Attribution: The framework and contents of this section were developed by Dr. Juliana Belding for the course MATH1100 Calculus I at Boston College, reproduced here with permission.
Problem-solving can mean many things. One way to describe it is as the ability to take an unfamiliar problem, make sense of the problem and come up with a way to solve it.
We’ll work with both word problems and other problems. In particular, word problems are a training ground for the skill of “mathematizing” a situation that has words and numbers. We’re not pretending these are necessarily realistic word problems but the point is for you to further develop your skills in more simplified situations and build your confidence. The hope is that this helps you become more comfortable looking at situations in a mathematical way, as you encounter more complicated ones.
A framework provides a structure to support logical problem-solving and slows you down, which is a good thing at first. As opposed to worrying that you can’t remember how to solve the problem immediately, you get used to brainstorming and taking time to make sense of the problem.
A framework provides a “common language” so students in different sections can better work with each other and with instructors and TAs from other sections.
Very Important!! We are NOT suggesting that there is always one way to approach a math problem. This framework is meant to support you to work on a problem in a systematic yet individual, creative way. In particular,
In homework or class, we’ll periodically ask you to try to use the framework. You will not be graded on precise use of the framework, but instead on the work shown and final results of your problem-solving.
We may model using the framework in class and in written solutions. Your work might look different or occur in different order than examples we provide. That is fine!
You may have a different approach to problem-solving that you like to use. That is fine! This is not meant to replace that, but rather to provide a(nother) pathway to problem-solving.
Here’s the framework. Warning! It can be overwhelming to read all at once. Instead we recommend you try an example problem alongside. Keep track of the things you do, and then come back to the framework, and see how it might help with solving the problem.
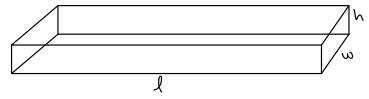
A swimming pool is 2 m deep, 5 m wide and 60 m long. Water is pumped into it at the constant rate of 100 liters per minute. How long does it take to fill the pool?
Here are some possible things to do to help you understand the problem. You don’t need to necessarily do all of them or to do them in a particular order.
In this step, the big point is to slow down and allow yourself to think versus trying to rely on a memorized approach. You brainstorm what could be relevant or useful to know or to do, and then make a plan to do it. You can actually carry out the plan in the next step. Here are some questions to help you.
What connections or relationships are there between known and unknown quantities? Does one change with the other?
It is important to note that your plan might not be the same as another person’s. There are many pathways to solve a problem! Also, you may have done some work in "Meet the Problem" that helps you make a plan. These two steps are very connected.
This is an optional step, but it is a great way to exercise your critical thinking, get curious and creative, and think about how the problem might connect to more real-world situations.
Were assumptions made in the problem? What were they? Are they reasonable?
"Word Problems" in math classes are notoriously artificial. In what ways is the problem NOT realistic or practical? How could you change it to better reflect reality?
Myth: If you can’t solve a problem in 5 minutes, this means you can’t do it.
Definitely not! It might mean re-reading the problem to see it with new eyes, taking a break, or talking to a friend, classmate, or instructor about what you are thinking (but not asking them how to do it).
There are many ways to solve most every problem. We are sharing a framework, not a formula. Your work using this framework may look different than your peers or instructor.
While this will be true of most of the problems we do in this course, in many situations, there are a range of answers depending on the assumptions and parameters of the problems.
You’ll notice that there is NOT one way to use the framework. You might have written more or less than here. The author here included some side thoughts, too, in parentheses. As you solve problems, you should feel free to add your personality and make it your own!
Here is a worked solution to Example Checkpoint 0.2.1. Remember: there are many ways to apply this framework! Your process may vary substantially to what is shown below.
The dimensions of the pool are in meters but the rate is in liters per minute. So we’ll have to find a conversion before dividing or change units afterwards. We can use that 1 m\(^3\)\(=\) 1,000 liters. 4
A quick Google search will tell you this.
We have a choice: cubic meters to liters or from liters to cubic meters? Let’s do the first one 5
An alternate plan: Convert the rate 100 L/min to a rate with units cubic meters per minute. You get a rate of 0.1 cubic meters per minute.
Now we need to convert. We want to convert cubic meters to liters. Since 1 cubic meter is 1000 L, the total volume in liters is \(600 \cdot 1000 = 600,000\) L. (More than I expected!)
Did we answer the problem? It said "how long"? So 6,000 minutes. This is hard to think about, so how many days would this take? There are \(24\cdot 60 = 1440\) minutes in a day, so this is about 4 days.
We always want to check units. Here’s where we might catch ourselves if we forgot to convert, since we’d get units of cubic meters per (liters/minute) which is not just minutes.
Critique and/or Change the Problem Here are some things we commented on, but you might have different ones. This is a place to be curious and think beyond the boundaries of the problem.
This pool is odd-shaped. It’s long but not that deep. How does it compare to an Olympic-size swimming pool?
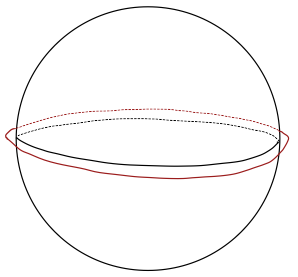
The circumference of the Earth is approximately 40,000 kilometers, and someone has just made a metal band that circles the Earth, touching the ground at all locations. You come along at night, as a practical joke, and add 10 m to its length. The band is now sits magically just above the ground at all locations creating a gap.
From the picture, we see the space we want is the difference in the radius of the bands. We have the original radius \(r\) and the new radius \(r_{new}\text{.}\)
The new band is 40,000 km + 10 m in circumference, so we can use \(C_{new} = 2\pi r_{new}\) to find the new radius \(r_{new}\text{.}\) We need to convert 10 m to km first.
An alternate plan: There are other ways to approach this. For example, we can name the gap \(\Delta r\text{,}\) since it’s the change in radius. Then \(r_{new} = r + \Delta r\text{,}\) and \(C_{new} = 2\pi(r + \Delta r) = 2\pi r + 2\pi \Delta r = C + 2\pi \Delta r\text{.}\) The difference in circumference is 10 m and it’s \(2\pi \Delta r\) so we can solve for that gap.
I notice that it doesn’t seem to matter how big the original circumference is because \(r_{new} - r = 40000.01/2\pi - 40000/2\pi = 0.01/2\pi\text{.}\) The change in radius only depends on the change in circumference, not the original circumference.
Critique and/or Change the Problem Here are some things we commented on, but you might have different ones. This is a place to be curious and think beyond the boundaries of the problem.
This is a strange problem - how could we make a band around the earth? Also, why is this a funny joke?
The Northeast Regular train leaves NY for Boston at noon going a constant rate of 55 mph. The Northeast Acela train leaves NY for Boston at 1 pm going a constant rate of 70 mph. They travel on parallel tracks. Does the Acela pass the Regular? If so, when? If not, why not?
We know the speeds of the train and when they leave. The Regular train is going 55 mph. It leaves NY at noon. The Acela train is going faster at 70 mph. It leaves from NY at 1 pm.
Goal: We want to know if the two trains are ever at the same location between NY and Boston (meaning they’ve traveled the same distance in the same amount of time).
We need to track distance over time. Let’s call \(R(t)\) the distance traveled by the Regular train at time \(t\text{.}\) Here \(t\) is time in hours, and we can measure since noon (so \(t = 0\) is 12 noon). Let’s call \(A(t)\) the distance traveled by the Regular train at time \(t\text{.}\)
We need to know how much distance each train covers over time, so we will create a formula for the distance function for each train, \(R(t)\) and \(A(t)\text{.}\)
An alternate plan: Make a table of values of distance versus time for each train. Then use that to make the functions or to conclude if they pass or not.
Carry out Your Plan \(R(t) = 55t\text{,}\) since it travels 55 mph and leaves at noon (\(t =0\)). \(A(t) = 70(t-1)\) since it goes 70 mph but only has traveled since 1 pm, so for example at \(t = 2\) its only traveled 1 hour thus only \(70 \cdot 1\) miles. Solve \(55t = 70(t-1)\) to get \(t = 70/15 = 4.\overline{6}\) hours. This means the trains would meet after \(4.\overline{6}\) hours. But the trip for the Regular train only takes \(216/55 \approx 3.93\) hours, so the Regular train will already have arrived in Boston. They don’t meet!
In 2020, a forest of 5 million trees was invaded by insects. 40% of the forests’ original trees were susceptible to the insects, and of these, two-thirds die off. After that, each year, two-thirds of the remaining susceptible trees die off. Assuming no new trees grow in the forest and no other trees are harmed, how many trees are in the forest at the start of 2030? What happens to the forest in the far future?
Quantities that change are time \(t\) (in years), total trees \(T\text{,}\) and susceptible trees that die off and trees that remain. The number of other trees (non-susceptible) doesn’t change.
Notice this is an exponential decay situation. We are keeping \(\frac{1}{3}\)(\(\approx\) 33%) of the remaining susceptible trees each year, meaning \(\frac{1}{3}^t (0.4)(5)\) trees. We can add this to the other non-suspectible trees which remain constant, \(0.6(5)\) to get the formula for total trees:
Now \(T(10) = (0.6)(5) + (\frac{1}{3})^{10} (0.4)(5) \approx 3.00003\) million trees. We can also calculate \(T(100) = (0.6)(5) + (\frac{1}{3})^{100} (0.4)(5)=3\) million trees and that \(T(1000) = (0.6)(5) + (\frac{1}{3})^{1000} (0.4)(5) = 3\) million trees as well (according to a calculator), so there appear to be 3 million trees remaining after a long time.
Reflect Back (Looking Back) We answered the question. There are about 3.00003 million trees at the start of 2030. As a basic check, we see this is less than the original 5 million which makes sense since trees have died off and there were no new trees. As time goes on, fewer and fewer of the susceptible trees will be left. Eventually, the population remaining will be only the non-susceptible trees, so \((0.6)(5) = 3\) million trees, as calculated. Can you check your answer? We could check that our formula for \(T(t)\) matches what we put in the table. For example, that \(T(0) = 5\) and \(T(1) = (0.6)(5) + \frac{1}{3}(0.4)(5)\text{,}\) and so on.